scotty369
Scott Townsend
Projects
Blog
Resume
Senior Project Blog
Categories
All
(7)
Dataviz
(3)
LaTeX
(1)
Python
(1)
Quarto
(1)
R
(2)
analysis
(1)
code
(2)
news
(3)
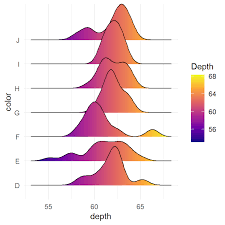
Ridgelines in R
R
Dataviz
In the realm of data visualization, the quest for insightful and aesthetically pleasing representations is ongoing. Enter
ridgeline plots
, a powerful tool for displaying…
Feb 23, 2025
Scott Townsend
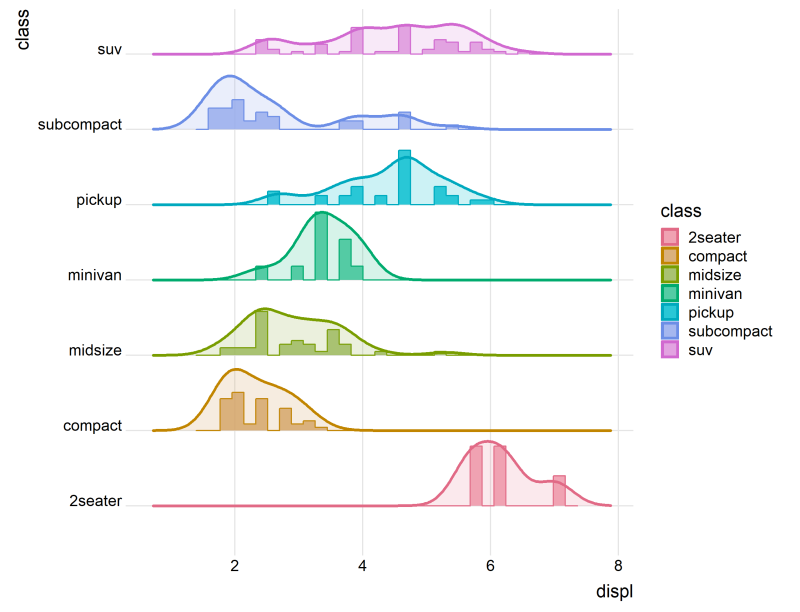
Ridgelines in Python
Python
Dataviz
In the world of data visualization, understanding the distribution of data across different categories is crucial. Ridgeline plots, also known as joyplots, offer an elegant…
Feb 23, 2025
Scott Townsend
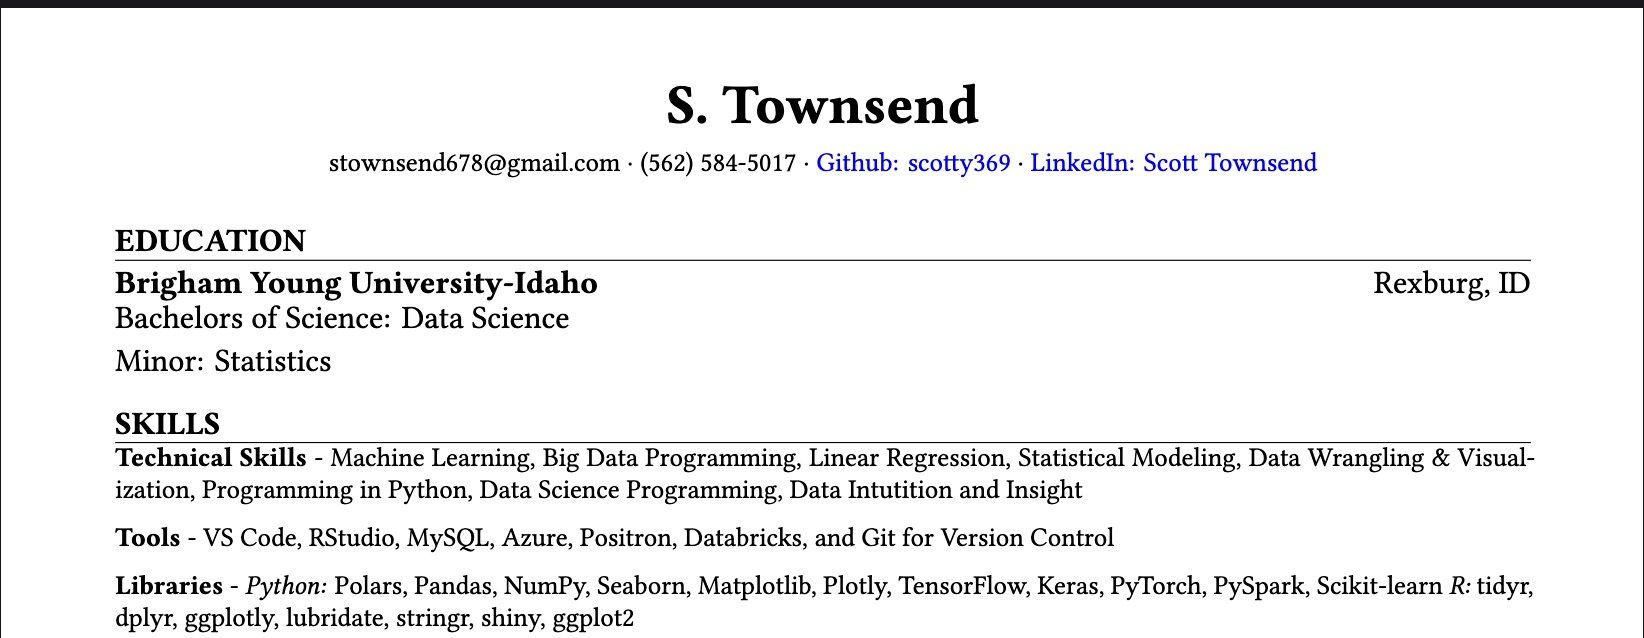
Resume
Quarto
LaTeX
Feb 23, 2025
Scott Townsend
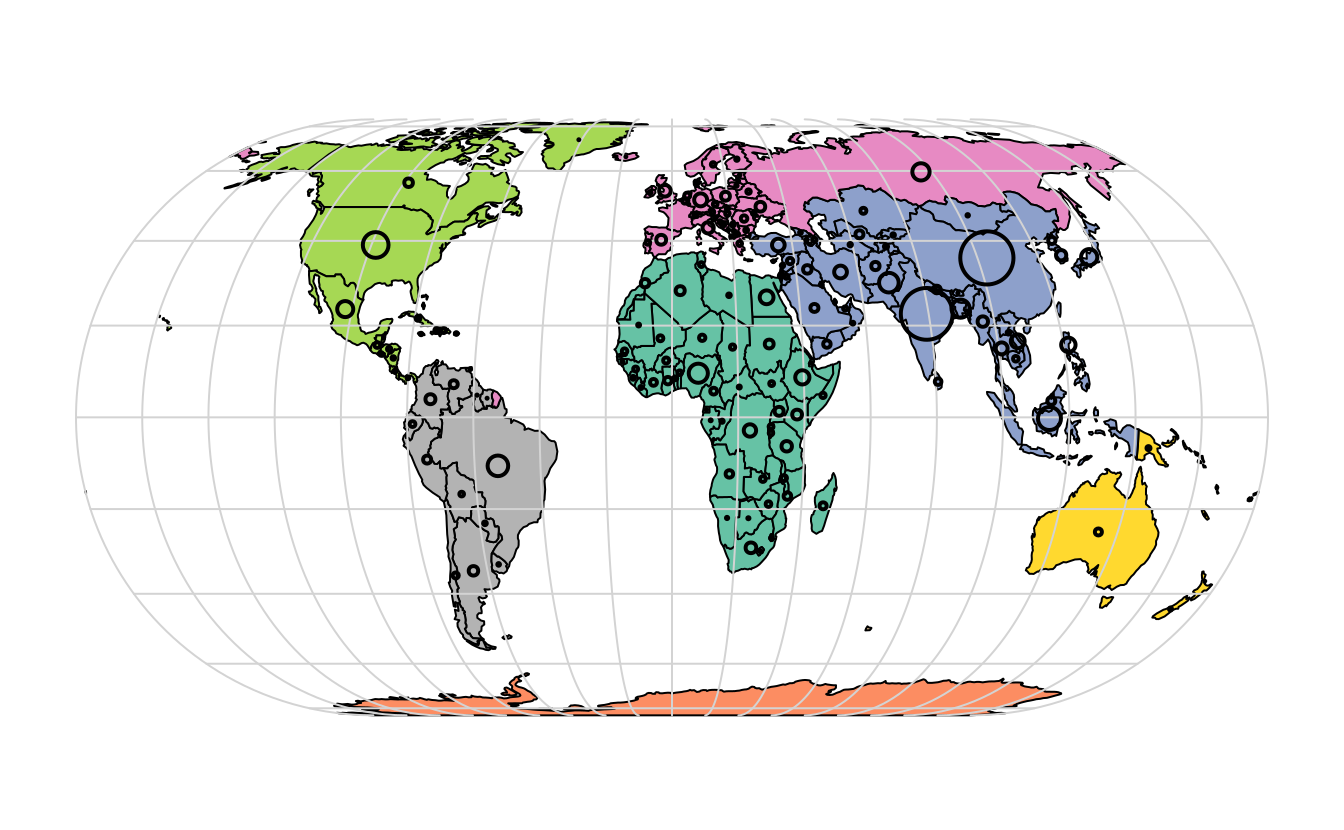
Spatial Charts in R
R
Dataviz
Spatial charts are a powerful way to visualize geographic data, allowing for insightful analysis of regional trends, patterns, and distributions. In R, spatial charts can be…
Feb 23, 2025
Scott Townsend
Week 3
news
code
Below is a visualization of the most popular words from the caption dataset. Notably, “Man” and “Woman” emerge as the most frequently mentioned words within the captions.
Feb 11, 2025
Scott Townsend
Week 2
news
code
Total captions: 40445 Average caption length: 11.78 words Max caption length: 38 words Min caption length: 1 words
Feb 4, 2025
Scott Townsend
Week 1
news
analysis
As part of my Senior Data Science Project, I’m creating a tool that automatically generates captions for images. This tool aims to help visually impaired individuals…
Jan 27, 2025
Scott Townsend
No matching items